Inspector Views Reference
Each NodeTypes.yaml can be used to configure views that are displayed inside the Neos inspector. Here follows the reference for each built-in view.
Data/ColumnView
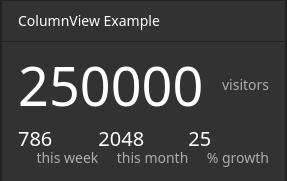
The ColumnView displays numeric data from a data source as a compact view.
A data source is a PHP class implementing Neos\Neos\Service\DataSource\DataSourceInterface (which is best achieved by extending Neos\Neos\Service\DataSource\AbstractDataSource). The example displayed above uses the following data source implementation:
<?php

/*
 * This script belongs to the package "Vendor.Site".
 */

declare(strict_types=1);

namespace Vendor\Site\Application\Neos\DataSource;

use Neos\Neos\Service\DataSource\AbstractDataSource;
use Neos\ContentRepository\Domain\Model\NodeInterface;

final class ColumnViewDataSource extends AbstractDataSource
{
    /**
    * @var string
    */
    static protected $identifier = 'vendor-site-column-view';

    /**
    * Get data
    *
    * {@inheritdoc}
    */
    public function getData(NodeInterface $node = NULL, array $arguments = [])
    {
        return [
            'data' => [
                'total' => [
                    'uniqueVisitors' => 250000,
                ],
                'thisWeek' => [
                    'uniqueVisitors' => 786,
                    'growthPercent' => 25,
                ],
                'thisMonth' => [
                    'uniqueVisitors' => 2048,
                    'growthPercent' => 25,
                ]
            ]
        ];
    }
}
Note
The data returned from a data source that is used for a ColumnView need not adhere to a specific shape. The viewOptions configuration is used to extract data from arbitrary data shapes as you’ll see below.
Example viewOptions:
'Vendor.Site:MyCustomNodeType':
  # ...
  ui:
    inspector:
      views:
        columnViewExample:
          label: 'ColumnView Example'
          group: examples
          view: 'Neos.Neos/Inspector/Views/Data/ColumnView'
          viewOptions:
            dataSource: vendor-site-column-view
            hero:
              data: total.uniqueVisitors
              label: 'visitors'
            columns:
              -
                data: thisWeek.uniqueVisitors
                label: 'this week'
              -
                data: thisMonth.uniqueVisitors
                label: 'this month'
              -
                data: thisMonth.growthPercent
                label: '% growth'
  # ...
viewOptions Reference:
dataSource(required string)Identifier of a DataSource (given in the implementation class)
arguments(optional array)If provided, the
argumentswill be passed as the second parameter to the data source’sgetDatamethod.hero(optional)The hero element will be displayed with a larger font above all other data points.
data(required string or array)A path to access the data from the data source. If given a string, the path will be split by
.. The data this path points to should be numeric.label(optional string)A brief description of the number provided through
data
columns(optional array)This is a list of data points that will be displayed below the hero element. Each element in this array has the following options:
data(required string or array)A path to access the data from the data source. If given a string, the path will be split by
.. The data this path points to should be numeric.label(optional string)A brief description of the number provided through
data
Data/TableView
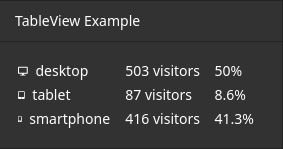
The TableView displays data from a data source as a table.
A data source is a PHP class implementing Neos\Neos\Service\DataSource\DataSourceInterface (which is best achieved by extending Neos\Neos\Service\DataSource\AbstractDataSource). The example displayed above uses the following data source implementation:
<?php

/*
 * This script belongs to the package "Vendor.Site".
 */

declare(strict_types=1);

namespace Vendor\Site\Application\Neos\DataSource;

use Neos\Neos\Service\DataSource\AbstractDataSource;
use Neos\ContentRepository\Domain\Model\NodeInterface;

final class TableViewDataSource extends AbstractDataSource
{
    /**
    * @var string
    */
    static protected $identifier = 'vendor-site-table-view';

    /**
    * Get data
    *
    * {@inheritdoc}
    */
    public function getData(NodeInterface $node = NULL, array $arguments = [])
    {
        return [
            'data' => [
                'rows' => [
                    [
                        'deviceCategory' => 'desktop',
                        'uniqueVisitors' => 503,
                        'percentage' => 50
                    ],
                    [
                        'deviceCategory' => 'tablet',
                        'uniqueVisitors' => 87,
                        'percentage' => 8.6
                    ],
                    [
                        'deviceCategory' => 'smartphone',
                        'uniqueVisitors' => 416,
                        'percentage' => 41.3
                    ],
                ],
            ]
        ];
    }
}
Note
The data returned from a data source that is used for a TableView need not adhere to a specific shape (as long as it represents some sort of list). The viewOptions configuration is used to extract data from arbitrary data shapes as you’ll see below.
Example viewOptions:
'Vendor.Site:MyCustomNodeType':
  # ...
  ui:
    inspector:
      views:
        tableViewExample:
          label: 'TableView Example'
          group: examples
          view: 'Neos.Neos/Inspector/Views/Data/TableView'
          viewOptions:
            dataSource: vendor-site-table-view
            collection: rows
            columns:
              -
                data: deviceCategory
                iconMap:
                  desktop: icon-desktop
                  tablet: icon-tablet
                  smartphone: icon-mobile-phone
              -
                data: uniqueVisitors
                suffix: ' visitors'
              -
                data: percentage
                suffix: '%'
  # ...
viewOptions Reference:
dataSource(required string)Identifier of a DataSource (given in the implementation class)
arguments(optional array)If provided, the
argumentswill be passed as the second parameter to the data source’sgetDatamethod.collection(required string or array)A path to access the collection of interest from the data provided by the data source. If given a string, the path will be split by
.. The data this path points to should be a numerically indexed array.columns(optional array)This key is used to configure the columns of the table. Each element in this array has the following options:
data(required string or array)A path to access the data of an item of the list described by
collection. If given a string, the path will be split by..iconMap(optional hashmap)Maps the value provided through
datato an icon that will be displayed in addition to the value.suffix(optional string)A brief description of the value provided through
data
Data/TimeSeriesView
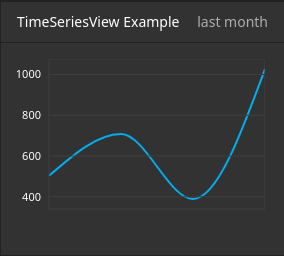
The TimeSeriesView displays data accumulated over time from a data source as a line chart.
A data source is a PHP class implementing Neos\Neos\Service\DataSource\DataSourceInterface (which is best achieved by extending Neos\Neos\Service\DataSource\AbstractDataSource). The example displayed above uses the following data source implementation:
<?php

/*
 * This script belongs to the package "Vendor.Site".
 */

declare(strict_types=1);

namespace Vendor\Site\Application\Neos\DataSource;

use Neos\Neos\Service\DataSource\AbstractDataSource;
use Neos\ContentRepository\Domain\Model\NodeInterface;

final class TimeSeriesViewDataSource extends AbstractDataSource
{
    /**
    * @var string
    */
    static protected $identifier = 'vendor-site-time-series-view';

    /**
    * Get data
    *
    * {@inheritdoc}
    */
    public function getData(NodeInterface $node = NULL, array $arguments = [])
    {
        return [
            'data' => [
                'rows' => [
                    [
                        'date' => new \DateTimeImmutable('2022-09-01'),
                        'uniqueVisitors' => 503
                    ],
                    [
                        'date' => new \DateTimeImmutable('2022-10-01'),
                        'uniqueVisitors' => 708
                    ],
                    [
                        'date' => new \DateTimeImmutable('2022-11-01'),
                        'uniqueVisitors' => 389
                    ],
                    [
                        'date' => new \DateTimeImmutable('2022-12-01'),
                        'uniqueVisitors' => 1027
                    ],
                ],
            ]
        ];
    }
}
Note
The data returned from a data source that is used for a TimeSeriesView need not adhere to a specific shape (as long as it includes a list of data associated with a time and date). The viewOptions configuration is used to extract data from arbitrary data shapes as you’ll see below.
Example viewOptions:
'Vendor.Site:MyCustomNodeType':
  # ...
  ui:
    inspector:
      views:
        timeSeriesViewExample:
          label: 'TimeSeriesView Example'
          group: examples
          view: 'Neos.Neos/Inspector/Views/Data/TimeSeriesView'
          viewOptions:
            subtitle: 'last month'
            dataSource: vendor-site-time-series-view
            collection: rows
            series:
              timeData: date
              valueData: uniqueVisitors
            chart:
              selectedInterval: weeks
              yAxisFromZero: false
  # ...
viewOptions Reference:
dataSource(required string)Identifier of a DataSource (given in the implementation class)
arguments(optional array)If provided, the
argumentswill be passed as the second parameter to the data source’sgetDatamethod.subtitle(optional string)A brief description for the time series chart that will be displayed in the top right corner
collection(optional array or string)A path to access the collection of interest from the data provided by the data source. If given a string, the path will be split by
.. The data this path points to should be a numerically indexed array.series(required object)This object configures each data point that will be used to draw the chart.
timeData(required array or string)A path to access the data of an item of the list described by
collection. If given a string, the path will be split by.. The data this path points to should represent a time and date (e.g. aninteger-typed unix timestamp or a\DateTimeInterface).valueData(required array or string)A path to access the data of an item of the list described by
collection. If given a string, the path will be split by.. The data this path points to should be numeric.
chart(optional object)This object configures the chart itself.
selectedInterval(optional, default=”years”)This field configures the scale of the x-axis. Possible values are:
years(orY)quarters(orQ)months(orM)weeks(orW)days(orD)seconds(orS)
yAxisFromZero(optional boolean, default=false)If set to
truethe y-axis will start from0. Otherwise the y-axis will start from the lowest available value.
NodeInfoView
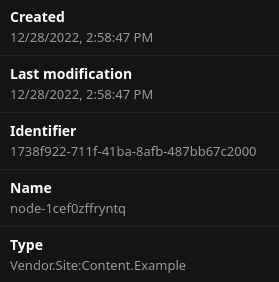
The NodeInfoView displays key characteristics of a node. In Neos, every node with a node type that extends Neos.Neos:Node (which applies to both content and document nodes by default), comes with a pre-configured NodeInfoView. It can be found in the Inspector under the meta tab.
It is unlikely, you’ll ever need to configure this view manually. But if you need to, you can use a configuration like this one:
'Vendor.Site:MyCustomNodeType':
  # ...
  ui:
  inspector:
    views:
      nodeInfoViewExample:
        label: 'NodeInfoView example'
        group: examples
        view: 'Neos.Neos/Inspector/Views/NodeInfoView'
  # ...
The NodeInfoView has no viewOptions.